You are at the right place if you are in the journey of trying to conceive or just want to understand your reproductive health better. Getting this right is helpful if you want to get pregnant quicker!
Mastering Fertility Charting
The magical world of fertility charting – focusing on basal body temperature (BBT) tracking – is a powerful tool for understanding your body. It is your daily diary that can reveal secrets to your fertility and help you to get pregnant quicker!
Only about 13% of women are aware of their most fertile times during their menstrual cycle. This is a significant barrier for those trying to conceive or aiming to understand their reproductive health better. The fertile window – the days in a woman’s menstrual cycle where pregnancy is possible – is often misunderstood or completely unknown. This can lead to years of unnecessary frustration and confusion when trying to conceive. It can also lead to missed opportunities for those using natural family planning methods.
Understanding one’s fertility and providing tools and knowledge on basal body temperature charting we can begin to bridge the gap of non-information. This guide will be a step towards empowering women with knowledge and understanding of their bodies better; helping them to make informed decisions about their reproductive health and take control of their fertility journey.
Why Basal Body Temperature?
Your basal body temperature is the lowest body temperature attained during rest, usually measured immediately after waking up. Tiny changes in this temperature can tell you a lot about your reproductive status, particularly about ovulation – which is crucial when you are trying to conceive.
Charting your basal (BBT) daily can help you learn to detect ovulation  or the lack of ovulation. BBT is a window into the intricate workings of your body’s reproductive system. By charting your BBT every morning, you are not just marking down numbers; you are decoding signals your body sends about its fertility status and overall health.
This simple practice can unveil patterns and provide insights that are invaluable for anyone trying to conceive or simply aiming to understand their body better.
From the small shifts in temperature, you can learn a multitude of things about your body:
- BBT tracking can confirm ovulation. A sustained rise in temperature typically indicates that ovulation has occurred. This is important for timing intercourse for conception or understanding the rhythm of your cycle for natural family planning.
- BBT can hint at potential hormonal imbalances. For instance, consistently low temperatures throughout your cycle might suggest an underactive thyroid (hypothyroidism) as thyroid hormones play a significant role in regulating metabolism and body temperature.
- Erratic temperature patterns could signal thyroid overactivity (hyperthyroidism) or adrenal issues.
Also, the length and pattern of your BBT chart’s phases – the follicular phase before ovulation and the luteal phase after – can offer clues about your reproductive health.
- A short luteal phase might indicate low progesterone levels which can affect your ability to maintain a pregnancy.
- An extended follicular phase could suggest challenges with egg maturation or release, potentially pointing to conditions like Polycystic Ovary Syndrome (PCOS).
BBT tracking can also be a tool for early pregnancy detection. If your BBT remains elevated for 18 days or more after ovulation, it may be an early sign of pregnancy. It is important to also confirm pregnancy with a test for accurate results.
BBT tracking is more than a fertility tool. It’s a lens through which you can observe and understand the nuances of your body’s reproductive function and overall health. Paying attention to these patterns you are equipping yourself with knowledge that empowers you to make informed decisions about your reproductive health and well-being.
How Does It Work?
After ovulation, the hormone progesterone causes your body’s temperature to rise slightly. By tracking these temperature shifts you can pinpoint when ovulation occurs. This is vital because knowing your ovulation time can significantly increase your chances of getting pregnant.
Choose Your Tool to Get Started with BBT Charting
Digital Thermometer
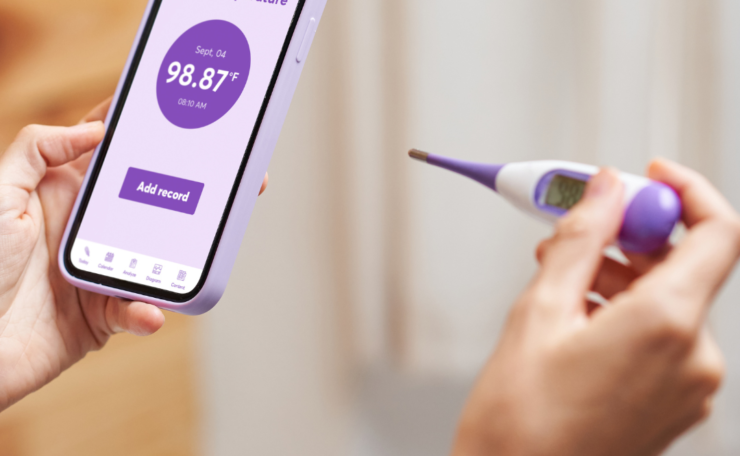
You will need to track your temperature. A basal body thermometer is what has been used for years. These are more sensitive than regular thermometers and provide a precise reading to the tenth of a degree which is necessary for detecting the subtle changes in your BBT.
You will need and app or print a paper chart to track your daily temperature and observe your fertility pattern. Try this fertility tech tool that can automatically take and track your basal body temperature.
Tempdrop
Tempdrop stands out as a versatile basal body temperature tracking device, designed to cater to a broad audience including those whose sleep patterns might be disrupted – such as shift workers and new parents. This is worn comfortably on the upper arm and it continuously monitors body temperature throughout the night. This device is engineered to collect a series of temperature readings which enhances the precision of data.
One of the key features of Tempdrop is its advanced algorithm. This technology is adept at distinguishing between genuine temperature shifts and those caused by sleep disturbances, such as getting up during the night or restless sleep. This provides the user with a dependable BBT reading each morning.
Tempdrop is compatible with its own app as well as a selection of other leading fertility charting applications. This compatibility offers users the flexibility to choose how they wish to analyze their fertility indicators-hands on approach to hart interpretations or the convenience of automated analysis for pinpointing their most fertile days. Here is a link to the product info and purchasing info with a discount for purchase.
When to Measure
Consistency is key! Measure your BBT every morning at the same time before getting out of bed. Even sitting up can increase your body temperature, so keep your thermometer within reach.
Recording Your Temperature
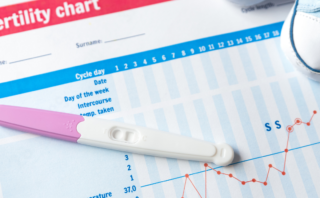
You can record your temperature on a paper chart, a digital app or an online tool. Apps offer the convenience of being able to log your BBT and other fertility signs.
Interpreting Your BBT Chart
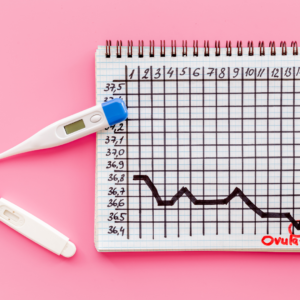
You will notice patterns once you start charting. You will most likely see lower temperatures before ovulation and higher ones after. The day after your temperature spikes is most likely the day after you have ovulated.
What to Look For
- A biphasic pattern: Your chart should show two phases – lower pre-ovulation temperatures and higher ones post-ovulation
- A sustained temperature rise: To confirm ovulation, look for a rise in temperature that lasts at least three days
You are basically ready a story that your body is telling you about its reproductive cycle when you look at your BBT chart. Beyond ovulation, the patterns on your chart can reveal a wealth of information about your menstrual health and fertility.
A well-interpreted BBT chart can indicate the length and health of your luteal phase. A luteal phase that’s consistently shorter than 10 days may indicate luteal phase defect which can be a challenge for implantation and sustaining a pregnancy.
You could have low progesterone levels if your temperatures do not rise much after ovulation. Progesterone is crucial for maintaining a pregnancy.
You can also detect anovulatory cycles – no ovulation occurs – with pattern fluctuations in your BBT chart. This generally shows in a chart that lacks a clear and sustained temperature rise.
If pre-ovulation temps are erratic, it could be a sign of sleep disturbances or stress – both of which can impact your overall fertility.
If you temperatures are high throughout your cycle, it could be a sign of hyperthyroidism. Low temps can indicate hypothyroidism. Both can affect menstrual regularity and fertility.
Tracking your BBT over several cycles will help you to see patterns that may help predict future ovulation. This can allow for better planning for conception. These patterns can also help in managing natural birth control methods with more confidence.
These patterns on your BBT chart are not random data points. They are meaningful indicators of your body’s reproductive function. By learning these patterns, you can gain insights into your menstrual health, identify potential issues early and take proactive steps towards achieving your fertility goals.
Other Fertility Signs
Combining BBT with other fertility indicators can provide a clearer picture.
Cervical Mucus
The quality and quantity of cervical mucus change throughout your cycle. Around ovulation it becomes clear, stretchy and slippery – like egg whites. This is a sign of peak fertility.
Cervical Position
During fertile days, your cervix is higher, softer and more open. You can learn to check this yourself. It takes some practice to distinguish the changes.
What if My Cycles Are Irregular?
BBT charting can still be beneficial. It may take a few cycles to see your patterns but consistency is the key. If irregularities persist, consider having a health care provider rule out conditions like PCSO or thyroid issues.
Charting Your Path To Pregnancy
Every woman’s body is unique and so is every cycle. Fertility charting isn’t just about getting pregnant; it’s about connecting with your body’s unique rhythms and signals. Whether you are charting to conceive or just to know your body better, the insights you can gain can be very empowering.
So, let’s start charting! Your journey to understanding your fertility better begins right now! Each cycle is a step closer to understanding your fertility and potentially to achieving your pregnancy goals!
There is a lot you can do to support each phase of your cycle. Lifestyle choices, foods, exercise all can be adapted to which phase of your cycle you are in as each phase has different requirements. If you would like help with decoding your cycle and how to support it, let me know!


